A Top 10 Finalist for iDA’s inaugural Data in the City: Visualisation Challenge 2014 in conjunction with Singapore’s SG50 celebrations.
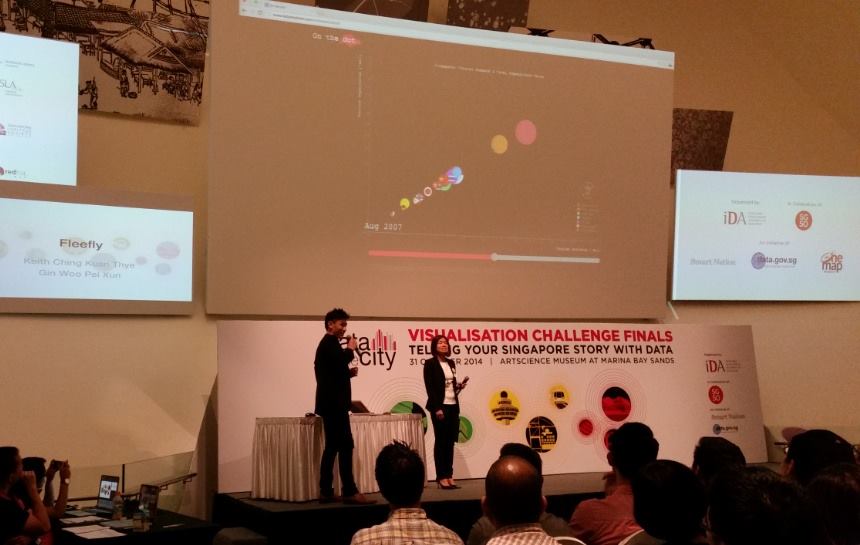
On the Dot is a virtual historical atlas of Singapore’s tourism landscape. It showcases Singapore’s total visitor arrivals from different countries over the years, their total expenditure value (TEV) and the popularity of our top attractions. It also shows how these figures change through major world / domestic events, and trends that have happened.
Tools/Tech: D3, HTML5, Excel
Data used: Air Passenger Arrivals, Annual Tourism Statistics, Wildlife Reserves Yearbook, NParks Annual Report
Strength of visualisation: Story-telling using Open Data
Check it out here.